When it comes to load testing a web application, usually JMeter comes up as the go-to solution. It has a huge amount of features, protocol support, is opensource, establishment - and boy it has a GUI! There are some other alternatives like pyLot, locust, Grinder, radview, wapt or LoadUI which are either commercial or not as feature rich and less established.
Lately, some hosted solutions like loader.io, neotys, blitz.io, blazemeter, loadstorm etc. joined the party. These offerings are nice for testing the whole stack from an end-user perspective or running limited tests. The downside is, that these are typically sold by bandwidth or threads (users) which is a good business model but comes unhandy when really stress testing an application over a long period of time or testing within an internal network.
Usability
One of the biggest benefits of JMeter, in many peoples minds, has been its graphical user interface. Well, it’s kinda powerful and it kinda allows easy test creation. People tend to think that a GUI makes everything easier since many concepts are well known.
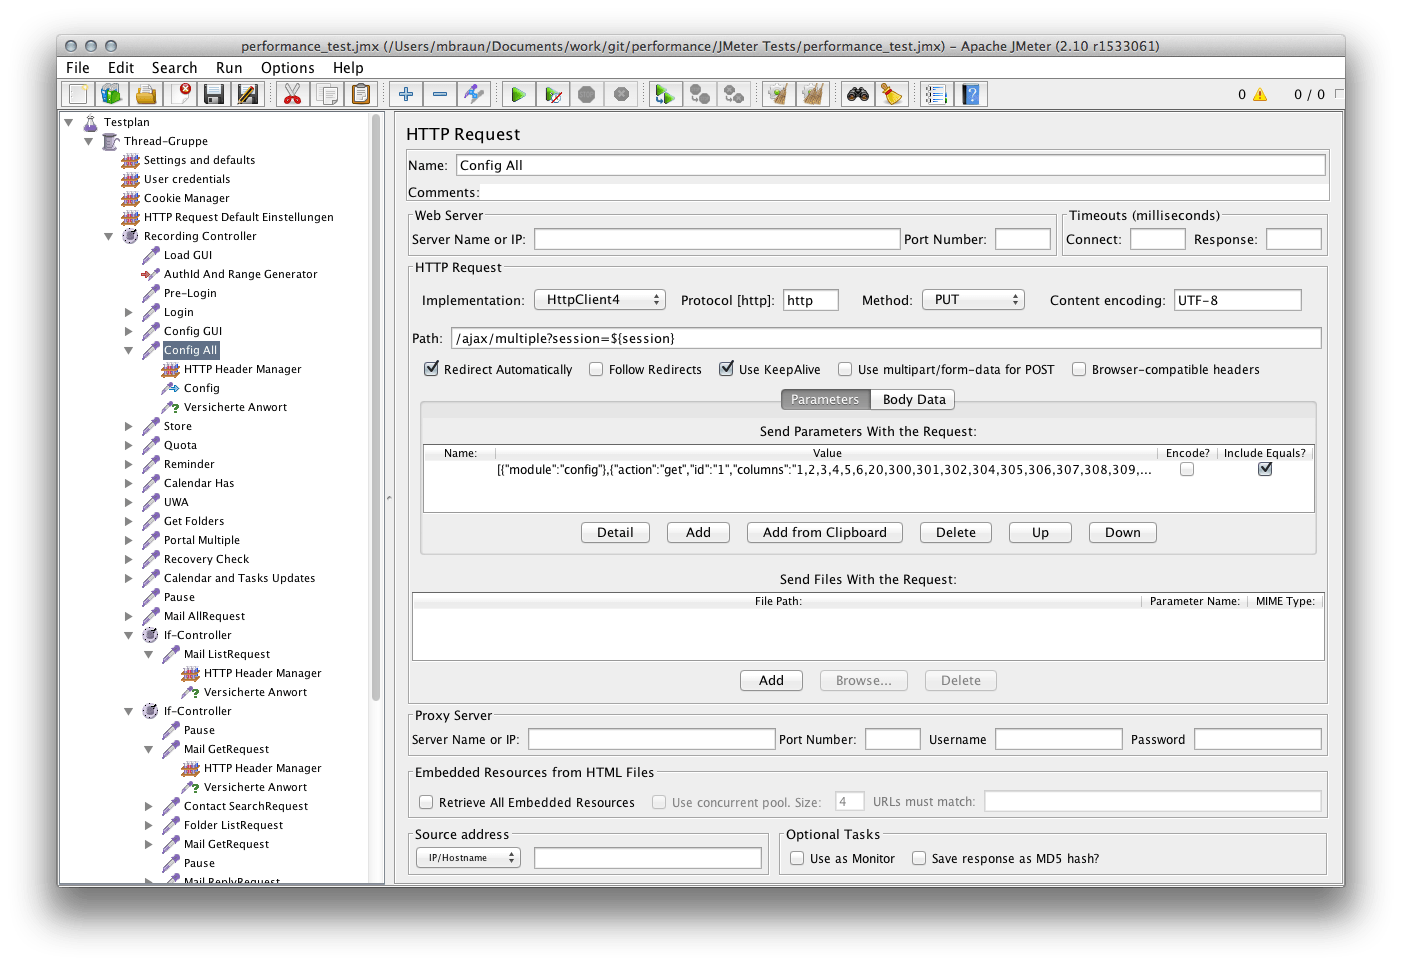
In my opinion the opposite is true, at least for JMeter. Its GUI is quite bloated, which is natural given its complexity and amount of features, but in the end is some button-input-and-knob representation of an XML structure. Under the hood, JMeter generates massive amounts of XML, based on what tests the user defined at the GUI. By itself, this is not bad. However, it shuts down any serious attempt on manual interaction on an XML level. This becomes very visible when using JMeter tests while working within a team. We use git for source control and due to a lack of good and powerful GUI based tools, primarily work with the command line implementation. Reviewing commits or merging is really a pain when you have to diff and compare on a XML level.
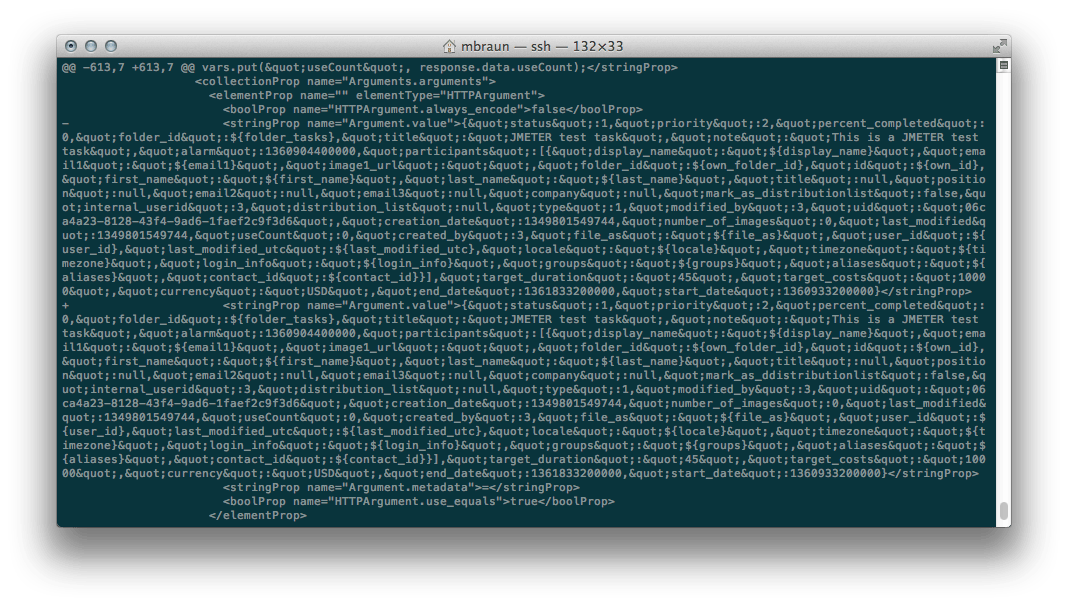
Readability of code is usually determined by the skills of the author, in this case the author really doesn’t do anything wrong - but by focusing on a GUI, readability for all other forms of representation suffers. Even if you manually tame the XML output, JMeter will just overwrite it using machine-readable-only code. XML is very well structured but apart from being structured, there are other requirements to good code. Even easy tasks like replacing some parameter or defining properties becomes a pain using the GUI since you have to browse it and manually spot elements. Either you got almost everything within variables, or you’re doomed.
In my opinion, JMeter is nice to rapidly create one-shot tests that can be shown around for education, validation or audit. For any kind of sustainable agile development or testing, it’s next to useless.
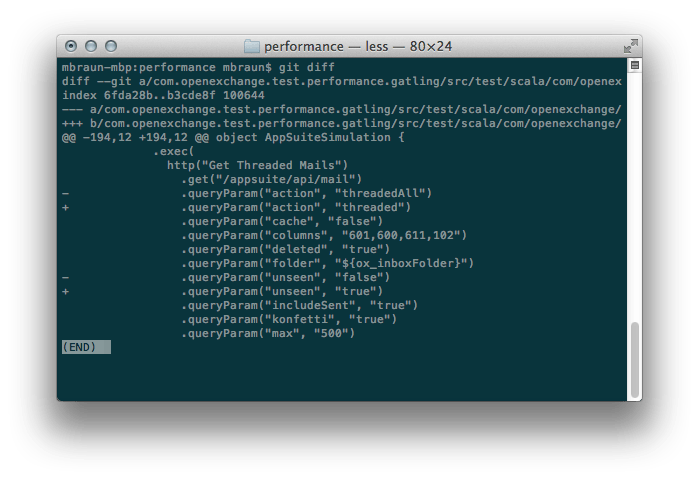
Gatling on the other hand uses Scala to define load tests. Scala is probably not as established as XML but (as programming languages in general) it allows to code much cleaner and use the power of a functional programming language. Being object oriented and relatively up to date, it allows re-using code to avoid redundancy and pretty much everything one would expect from a modern programming language. While coding Scala requires some specific toolchain, the compiled code runs within a standard JVM. This makes it very easy to deploy and leverage existing workflows and tools. If you’re a programmer you probably can start with Scala right away. If you’re not familiar with programming, some hurdle may exist but learning a programming language while creating load tests sounds a good deal, right? There is no need to learn each and every bit of Scala right away, tests usually consist of the same fragments that just need to get put together.
Since Gatling is under very active development and currently transitioning from version 1 to version 2, some API vs. documentation hickups and bugs may happen from time to time. The core developers and community is very responsive and most issues get covered within hours.
Performance
The funny thing about load tests is, that many environments actually test the efficiency and performance of the test runner, rather than the application thats supposed to be tested. In projects i’ve seen people building monstrous phalanxes of test clients to stress-test a single server. Distributed test clients and down-sizing both the servers spec and the test coverage seem to be appropriate measures to get the server under load. Lets check some real-world example.
At work we got a nice Intel Modular Server box dedicated for load testing. This baby sports a chassis with redundant PSU, networking, storage and six identical blades loaded with dual Xeons and lots of memory. In a nutshell, this is a datacenter within 6HE where testing can happen without external influences. Earlier, we used one virtual machine as test director and result-parser, 4 machines running JMeter and one machine running the application (including all infrastructure) we wanted to test. JMeter has been configured to spread the test scenario to all 4 machines, effectively cutting the number of threads by 4 and feed them to the test clients to execute them simultaneously. While this worked well, it really felt odd to have 4 specialised machines hammering on one specialised machine to push it to its limits.
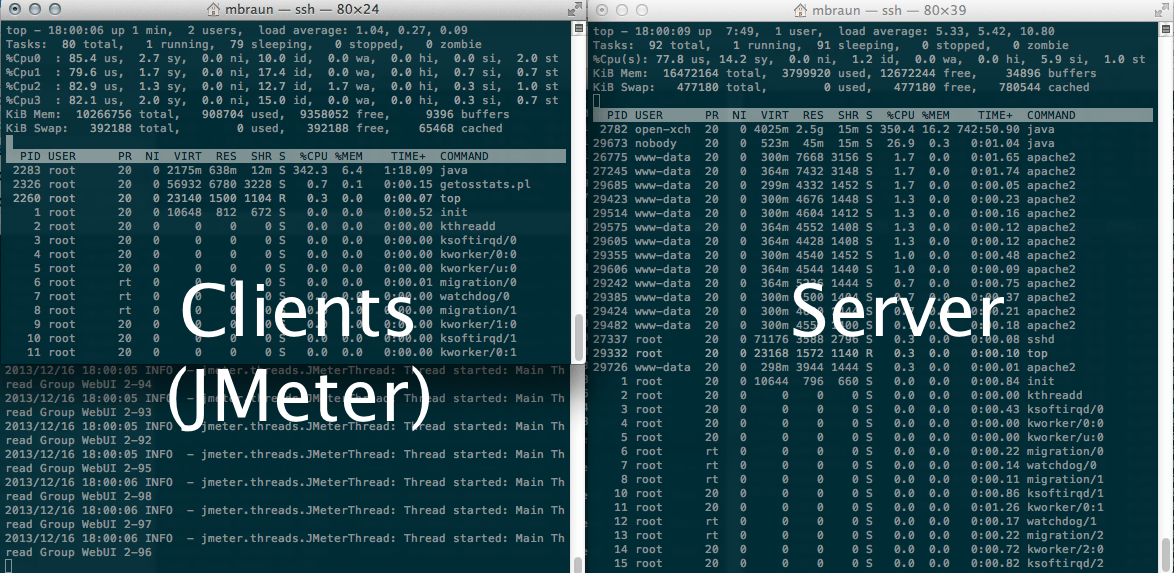
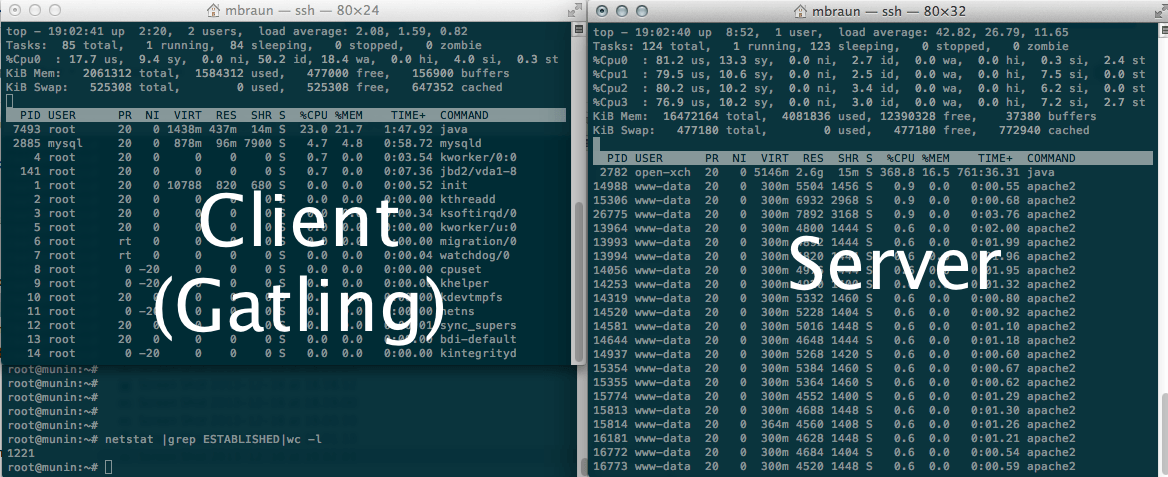
What we see at this screenshot is one machine running about 100 concurrent threads (“virtual users”) occupying 4 CPUs. The server on the other hand is also quite stressed but keep in mind there are 4 test machines with 4 CPUs each running 400 concurrent threads in total. Even these 4 test machines did not manage to create significant load at the server, to find out its diminishing or even tensile point. One major drawback with JMeter is that it uses one system thread per user, handling large numbers of active threads is very expensive on the CPU.
When using Gatling, we easily manage to get 1200 concurrent threads running at just 25% CPU load of one CPU of a single virtual machine. This is about 200x more efficient than JMeter (1/64th of the CPU load while creating 3x the load). The server is also stressed quite well and we’re able to push load testing far beyond its tensile point.
Reporting
When running JMeter using its GUI, reports are fairly nice, real time and the tool offers some help to dig through the results. However, when not being able to use the GUI (e.g. for unattended testing, continuous integration), you get a bunch of .jtl files, either XML or CSV. These can then be put into JMeter again for analysis or get processed using XSLT or tools that understand CSV (yeah… Excel). Thats all good and at this point highly structured data makes a lot of sense. There is a variety of tools that help with graphing, charting and analysing of its data. The downside is that you almost always need some kind of extra tool to make JMeter reports understandable - and you always have to wait until the test run finished. At least to my knowledge, there is no realtime graphing apart of the JMeter GUI.
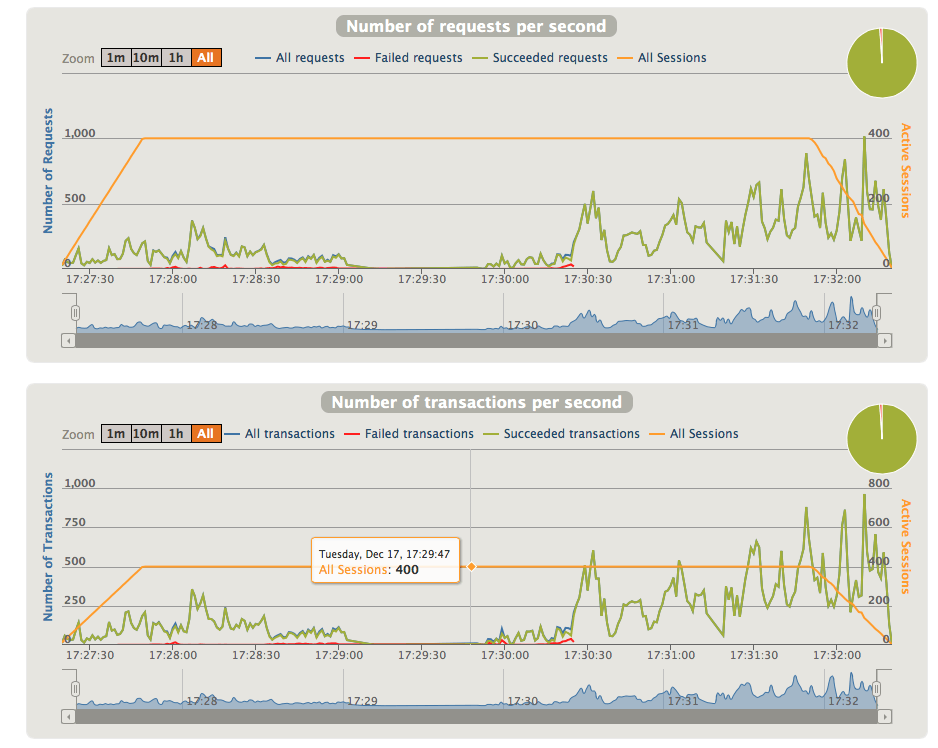
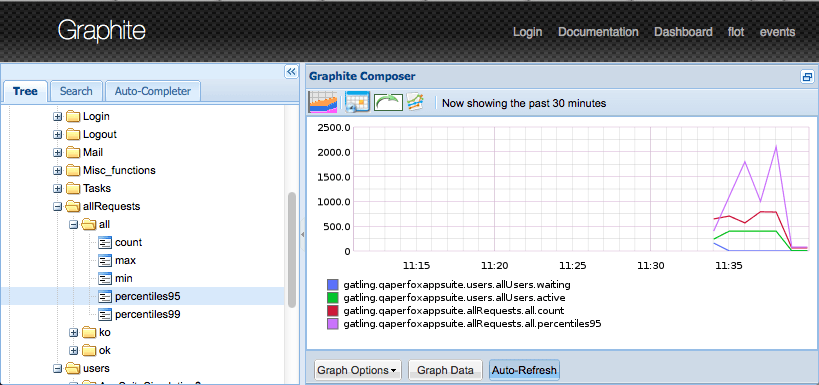
Gatling also creates machine readable data files, but already provides a really nice report module that generates HTML pages with charts and graphs. In addition, the integrated Graphite feeder allows real-time charting of test runs to tools like Graphite or Grafana. This becomes really powerful for showcases or unattended test runs. Overall i think the built-in reporting of Gatling outperforms JMeter by large, even if JMeter reporting may be more accurate and comprehensive on a scientific level.
As with every discussion, there is no “using the wrong tool” - it just depends on the job that needs to be done and some thinking outside the box. There are a lot of great tools that are not (yet) mainstream but help with every days work and contribute to getting better tests, results and software.